How Political Polling Works

By: Dave Roos
primary voting
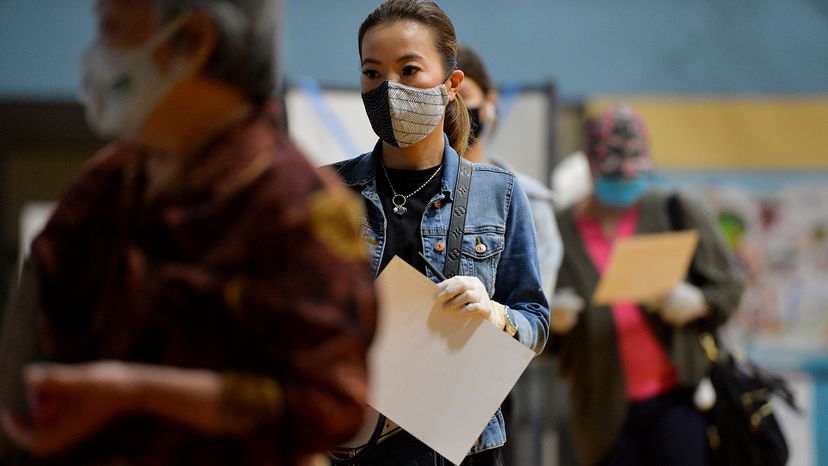
People wait in line to hand in their ballots to election officials after voting at a YMCA in Chinatown during the Massachusetts State Primary on Sept. 1, 2020 in Boston. Political polling tries to determine how people will vote in an election. JOSEPH PREZIOSO/AFP via Getty Images

The news cycle is jam-packed with polls. Flip on the nightly broadcasts or browse online news articles and you'll be bombarded by the latest "statistics" about the percentage of Americans who believe in God; the breakdown of dog-lovers versus cat-lovers; and how many people between the ages of 65 and 85 own a Nintendo Switch. When it's an election year, poll numbers are headlines in themselves: "Clinton Leads Trump Among College-Educated Voters;" "Republicans More Likely to Vote Than Democrats;" and even the occasional "Dewey Defeats Truman!"

Sure, polls make great headlines, but how accurate are they? How much faith should we put in polls, particularly political polls that attempt to predict the outcome of an election? Who conducts these polls, and how do they decide whom to ask? Is it possible to achieve a representative sample of voters from randomly pulling numbers out of the phone book?

Advertisement

Political polling is a type of public opinion polling. When done right, public opinion polling is an accurate social science with strict rules about sample size, random selection of participants and margins of error. However, even the best public opinion poll is only a snapshot of public opinion at the particular moment in time, not an eternal truth [source: Zukin]. If you poll public opinion on nuclear energy right after a nuclear disaster, it's going to be much lower than the day before the disaster. The same is true for political polls. Voter opinion shifts dramatically from week to week, even day to day, as candidates battle it out on the campaign field.

Political polling wasn't always so scientific. In the late 19th and early 20th centuries, journalists would conduct informal straw polls of average citizens to gauge public opinion on politicians and upcoming elections [source: Crossen]. A newspaperman traveling on a train might ask the same question to everyone sitting in his car, tally the results and publish them as fact in the next day's paper.

In the 1930s, the popular magazine "Literary Digest" conducted public opinion polls of its large subscribership by mail and phone, believing that a large sample size would automatically generate infallible results. The magazine failed to notice that its readership was wealthier and more likely to be Republican than the average U.S. voter, leading the magazine to erroneously predict a landslide victory for Alf Landon over Franklin D. Roosevelt in 1936 [source: Crossen].

Today, the top political polling organizations employ mathematical methods and computer analysis to collect responses from the best representative sample of the American voting public. But there's still plenty of "art" in the science of political polling. Even random responses must be adjusted and sifted to identify subtle trends in voter opinion that can help predict the eventual winner on Election Day.

Let's start our examination of political polling with the most important indicator of accuracy: a representative sample.

Advertisement
Getting a Representative Sample

The mission of political polling is to gauge the political opinion of the entire nation by asking only a small sample of likely voters. For this to work, pollsters have to ensure that the sample group accurately represents the larger population. If 50 percent of voters are female, then 50 percent of the sample group needs to be female. The same applies to characteristics like age, race and geographic location.

To get the most accurate representative sample, political pollsters take a page from probability theory [source: Zukin]. The goal of probability theory is to make mathematical sense out of seemingly random data. By creating a mathematical model for the data, researchers can accurately predict the probability of future outcomes. Political pollsters are trying to come up with models that accurately predict the outcome of elections. To do that, they need to start with a perfectly random sample and then adjust the sample so that it closely matches the characteristics of the entire population.

Advertisement

The most popular method for achieving a random sample is through random digit dialing (RDD). Pollsters start with a continually updated database of all listed telephone numbers in the country. For land — both landline and cell phones. If they only called the numbers in the database, then they'd exclude all unlisted numbers, which wouldn't be a truly random sample. Using computers, pollsters analyze the database of listed numbers to identify all active blocks of numbers, which are area codes and exchanges (the second three digits) actively in use. The computers are then programmed to randomly dial every possible number combination in each active block [source: Langer]. Note that landlines and cell phones are assigned different blocks of exchanges or last four digits. This is how pollsters get around the fact that there are no directories of cellphone numbers, as there are for landlines and determine which they are reaching.

For a truly random sample, pollsters not only need to dial random numbers, but choose random respondents within the household. Statistics show that women and older people are far more likely to answer the phone than other Americans [source: Zukin]. To randomize the sample, political pollsters often ask to speak to the member of the house with the most recent birthday. This method is only used when dialing landline phones.

Once a political polling organization has collected responses from a sufficiently random sample, it must adjust or weight that sample to match the most recent census data about the sex, age, race, and geographical breakdown of the American public. We'll talk more about weighting in a later section, but first, let's settle some of the mystery behind margins of error.

Advertisement

Margins of Error

What does it really mean when the news anchor says: "The latest polls show Johnson with 51 percent of the vote and Smith with 49 percent, with a 3 percent margin of error"? If there is a 3 percent margin of error, and Johnson leads Smith by only 2 percentage points, then isn't the poll useless? Isn't it equally possible that Smith is winning by one point?

The margin of error is one of the least understood aspects of political polling. The confusion begins with the name itself. The official name of the margin of error is the margin of sampling error (MOSE). The margin of sampling error is a statistically proven number based on the size of the sample group [source: AAPOR]. It has nothing to do with the accuracy of the poll itself. The true margin of error of a political poll is impossible to measure, because there are so many different things that could alter the accuracy of a poll: biased questions, poor analysis, simple math mistakes, etc.

Advertisement

Instead, the MOSE is a straightforward equation based solely on the size of the sample group (assuming that the total population is 10,000 or greater). As a rule, the larger the sample group, the smaller the margin of error. For example, a sample size of 100 respondents has a MOSE of +/- 10 percentage points, which is pretty huge. A sample of 1,000 respondents, however, has a MOSE of +/- 3 percentage points. To achieve a MOSE of +/- 1 percentage point, you need a sample of at least 5,000 respondents [source: AAPOR]. Most political polls aim for 1,000 respondents, because it delivers the most accurate results with the fewest calls.

Let's get back to our tight political race between Johnson and Smith. Does a 2-percent lead mean anything in a poll with a 3 percent margin of sampling error? Not really. In fact, it's worse than you think. The margin of error applies to each candidate independently [source: Zukin]. When the poll says that Johnson has 51 percent of the vote, it really means that he has anywhere between 48 and 54 percent of the vote. Likewise, Smith's 49 percent really means that he has between 46 and 52 percent of the vote. So, the poll could just as likely have Smith winning 52 to 48.

Next we'll look at one of the most important factors that determine the accuracy of a political poll: the wording of the questions and answers.

Advertisement

Poll Questions and Answers

Questions and answers are the reason we have political polls. "Which candidate will you vote for in the election?" "Do you approve of the president's performance?" "How likely are you to vote in the midterm Congressional elections?" But the order of those questions, and the answers that respondents can choose from, can greatly affect the accuracy of the poll.

Ordering of questions is known to play a significant role in influencing responses to political polls. Let's use the example of the "horse-race" question, in which respondents are asked whom they would vote for in a head-to-head race: Candidate A or Candidate B. To ensure the most accurate result, political pollsters ask this horse-race question first. Why? Because the wording of preceding questions could influence the respondent's answer.

Advertisement

Polls, as we mentioned, are a snapshot of the respondent's opinion in the moment the question is asked. Although many voters have a firm and long-formed opinion on politics and political candidates, other voter's views are constantly evolving — sometimes from moment to moment. A respondent to a political poll might begin the poll with a slight lean toward Candidate A. But after a series of questions about Candidate A's views on the economy, foreign policy and social issues, the respondent might realize that he actually agrees more with Candidate B.

In pre-election polls, in particular, it is crucial to ask the race-horse question first, because voters enter the voting booth "cold," without first responding to a list of "warm-up" questions [source: Zukin].

Most political polls are conducted over the phone, and whether the pollster is a live interviewer or an automated system, there are usually set answers from which to choose. Political pollsters have discovered that the wording of these answers can offer improved insight into political opinions.

For example, the polling firm Rasmussen Reports tracks the approval rating of the president on a daily basis. Instead of simply asking if respondents approve or disapprove of his performance, Rasmussen asks them to choose from the following options: strongly approve, somewhat approve, somewhat disapprove or strongly disapprove. The firm has found that the "somewhat" options are important for capturing "minority" opinions [source: Rasmussen].

For example, if a registered Republican isn't thrilled with President Trump's performance, she still might choose "approve" over "disapprove" if those were the only options. But the "somewhat disapprove" option allows her to be more honest without undercutting her support of the president. Similarly, a registered Democrat could "somewhat approve" of a Republican president without feeling he has betrayed his party.

Advertisement

Weighting Poll Results

As we discussed earlier, randomness is important to achieving a representative sample of the population. By using random dialing software, political polling organizations try to reach a perfectly randomized sample of respondents. But there are limits to the effectiveness of random dialing. For example, women and older Americans tend to answer the phone more often, which throws off the sex and age ratios of the sample. Instead of relying exclusively on random number dialing, political pollsters take the extra step of adjusting or weighting results to match the demographic profile of likely voters.

Notice that we said "likely voters," not the entire voting age population of the United States. That's an important distinction. If pollsters wanted to weight their results to match the entire voting age population, then they would adjust the results to match the latest census data. First they would distribute results geographically, keeping more responses from more populous states and cities. Then they would adjust results to match the demographic distributions of sex, age and race in America.

Advertisement

But if you want to achieve the most accurate political polling results, you need to filter the sample even further to weed out all of the respondents who are unlikely to vote. This is where the "art" of political polling comes into play. The best pollsters are the organizations who can develop poll questions and analysis models that separate the wheat from the chaff and isolate the responses of the most likely voters only [source: Zukin]. After all, in politics, your opinion only counts if you actually vote.

Each polling organization has its own system for identifying and weighting likely voters, but common questions might include:

  • How old are you?
  • Have you registered to vote?
  • Do you intend to vote?
  • Are you paying close attention to the race?
  • Did you vote in past elections?
  • Do you know the location of your polling station?

Not all political polls are used to predict the outcome of elections. Sometimes pollsters want to gauge public opinion on different political issues, often in an attempt to compare the opinions of different demographic groups: old vs. young, Democrat vs. Republican, Black vs. white. In that case, pollsters don't aim for a perfectly representative sample. Instead, they engage in oversampling to build a sample that includes an equal amount of respondents from each demographic. For example, if you want to poll the attitudes of white and Black voters on a political issue, you would need to oversample Black households because a randomized sample would only include 10 to 15 percent black respondents.

Advertisement

Author's Note

I have never been contacted by a public opinion poll, and frankly, I'm a little hurt. Doesn't my educated and (obviously) fascinating opinion count for anything? In researching this article, I came across the following estimate of the number of polls conducted each year and the number of people contacted. If there are roughly 2,500 national polls conducted each year and each poll contacts 1,000 participants, then only 2,500,000 of the nation's 200 million adults get to participate each year. That gives me a one in 100 chance of getting a call from Gallup. Until then, I'm sticking to my same response every time I see the latest poll numbers claiming to represent the opinion of all Americans: "Well, nobody asked me."

Related Articles

Sources

  • American Association for Public Opinion Research. "AAPOR Statement on Push Polls." June 2007 (Sept. 1, 2020.) https://www.aapor.org/Education-Resources/Resources/AAPOR-Statements-on-Push-Polls.aspx
  • American Association for Public Opinion Research. "Margin of Sampling Error." (Sept. 1, 2020.) https://www.aapor.org/Education-Resources/Election-Polling-Resources/Margin-of-Sampling-Error-Credibility-Interval.aspx
  • Crossen, Cynthia. The Wall Street Journal. "Fiasco in 1936 Survey Brought "Science" to Election Polling." October 2, 2006 (Sept. 1, 2020.) https://www.wsj.com/articles/SB115974322285279370
  • Edison Research. "Exit Polling" (Sept. 1, 2020.) https://www.edisonresearch.com/edison-research-provides-national-exit-poll-data-and-vote-count/
  • Lambert, David; Langer, Gary; and McMenemy, Mike. Synovate. "Cell-Phone Sampling: An Alternative Approach." May 14, 2010 (April 11, 2012.) http://abcnews.go.com/images/PollingUnit/Cell-OnlySampling-Lambert-Langer-McMenemy-2010.pdf
  • Langer, Gary. ABC News. "ABC News' Polling Methodology and Standards." November 15, 2011 (Sept. 1, 2020.) https://abcnews.go.com/US/PollVault/abc-news-polling-methodology-standards/story?id=145373&page=5
  • Rasmussen, Scott. Rasmussen Reports. "Comparing Approval Ratings from Different Polling Firms." March 17, 2009 (Sept. 1, 2020.) http://www.rasmussenreports.com/public_content/political_commentary/commentary_by_scott_rasmussen/comparing_approval_ratings_from_different_polling_firms
  • Rasmussen Reports. "Methodology" (Sept. 1, 2020.) http://www.rasmussenreports.com/public_content/about_us/methodology
  • Zukin, Cliff. American Association for Public Opinion Research. "Sources of Variation in Published Election Polling: A Primer." October 2004 (Sept. 1, 2020.) https://www.aapor.org/getattachment/Education-Resources/Election-Polling-Resources/Election-Polling-AAPOR-2015-primary_cz120215-FINAL.pdf.aspx

Advertisement

Advertisement

Loading...