How Midterm Elections Work

By: Dave Roos  | 
Candidate signage, Laredo, Texas
Candidate signage is seen on a hill near the Laredo Fire Department polling site March 1, 2022, in Laredo, Texas. Texans headed to the polls that date to vote in the state's first primary of the 2022 midterm elections. Brandon Bell/Getty Images

Midterm elections are held in even-numbered years between presidential elections. They're called midterms because they coincide with the halfway point of a president's four-year term. For this reason, many political observers look to the midterms as a referendum on a sitting president's performance and a bellwether for which party will take control of the White House.

But midterm elections are about much more than simply testing the political winds for the next presidential election. They are a chance for Americans to go to the polls and vote for their representatives in Congress, state legislatures and local governments. While the presidential election isn't decided by popular vote (remember the electoral college?), midterm elections give Americans a chance to vote directly for the politicians who will likely have the greatest impact on their daily lives.

Advertisement

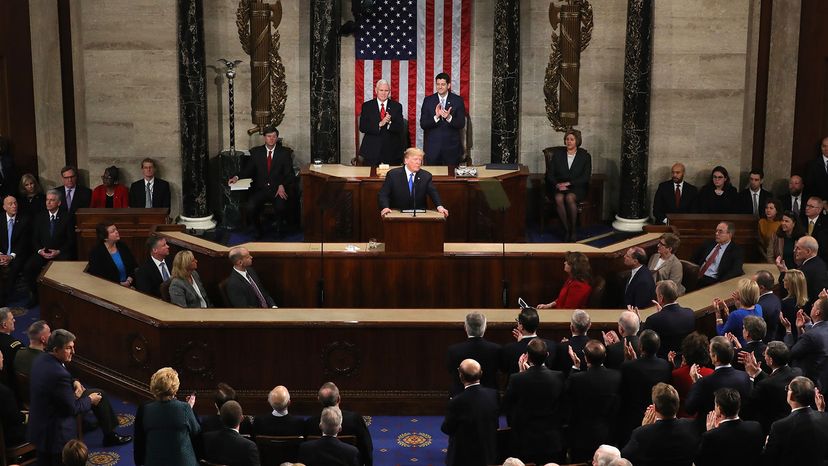
For example, every single seat in the U.S. House of Representatives is up for grabs during midterm elections. That's 435 separate races spread across all 50 states [source: USA.gov]. When you add the 34 Senate seats at play during midterms to the 435 House seats, you begin to understand the political significance of a strong showing on Election Day. The party that controls Congress has as much, if not more, political power than the party sitting in the White House.

Congress not only writes the laws and passes the spending bills, it also decides whether or not to approve the president's Supreme Court nominees and other major political appointees. And on the rare occasion when a president is caught committing a crime, it's Congress that votes whether to impeach. Those are even more reasons why midterm elections are a big deal.

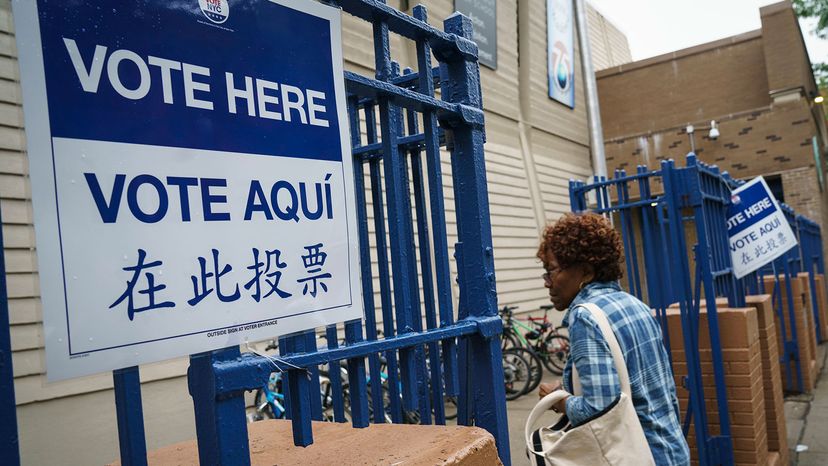
Despite the obvious political importance of midterms, shockingly few Americans actually vote in them. The average turnout of eligible midterm voters from 1972-2016 was a miserable 39.3 percent [source: Skelley and Kondik]. That means, on average, 60 percent of American voters stay home on midterm Election Day. The 2018 midterms were an outlier, with 53 percent of voting-age Americans going to the polls [source: U.S. Census Bureau]. The high turnout was likely due to the polarizing nature of then-President Donald Trump who energized Democratic voters to go to the polls.

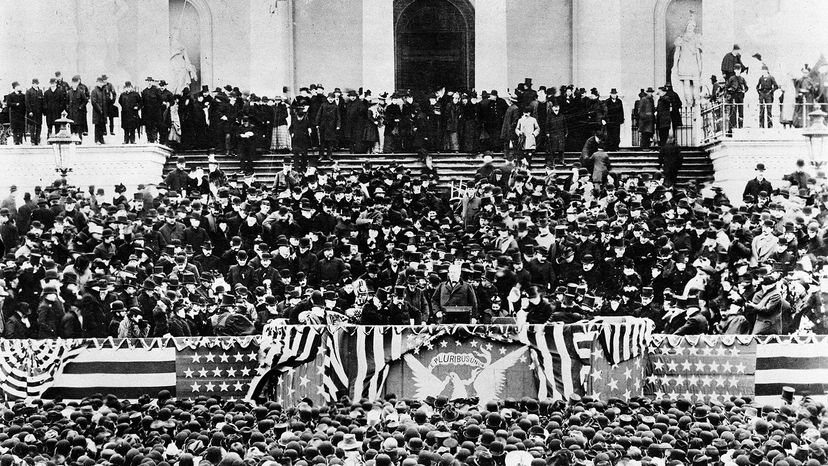
Keep reading to learn how midterms got started, what positions are up for election and why it's the civic duty of every American to cast their ballot in these off-year elections.

Advertisement

Federal Midterm Elections

Trump, house of reps
President Donald J. Trump delivers the State of the Union address in the chamber of the U.S. House of Representatives in Washington, D.C., 2018. Each House rep only serves two years, so they are all up for reelection at midterms. Chip Somodevilla/Getty Images

Put simply, midterm elections exist because not all elected offices in the United States federal government have four-year terms equal to the president. The terms of each elected office in the federal government were debated and settled during the 1787 Constitutional Convention and inscribed in the U.S. Constitution.

In the U.S. federal government, the only elected officials are the president, vice president and congressional representatives. Congress consists of two chambers, the Senate and the House of Representatives, each with its own term lengths and election schedules.

Advertisement

There are 100 U.S. senators, two for each state. Senators serve six-year terms, the longest of any elected official in the federal government. But not every Senate seat is up for election every six years. Instead, according to Article I, section 3, clause 2 of the Constitution, the Senate is divided into three "classes." In the modern Senate, each class consists of 33 or 34 senators. Senate elections are staggered so that one class is up for election every two years.

That's why every midterm election there are at least 33 or 34 Senate seats up for a vote. There can be more Senate seats up for election if a senator dies in office or resigns before the end of his or her term. The election schedule is also staggered so that no more than one Senate seat from each state is up for grabs during any single election, midterm or otherwise.

According to constitutional scholars, there were a couple of reasons why the Founding Fathers decided on a six-year term for senators with staggered elections every two years. First, senators are supposed to bring stability and continuity to the federal government. By serving six years, for instance, they may serve under two different presidents.

But that continuity comes with a price. The Founding Fathers worried that senators would become too chummy and permanently conspire for "sinister purposes" [source: U.S. Senate]. So, they decided to shuffle the senatorial deck every two years and put a third of the Senate seats up for a vote.

The House of Representatives is a different beast. Representation in the House is based on population, with more populous states getting more House seats at the table. The current House of Representatives has 435 members, each serving two-year terms, the shortest of federally elected officials.

The term length of representatives was another lively debate at the Constitutional Convention. The precedent, as set by colonial legislatures and early state legislatures, was that the representatives in state houses were elected every year and sometimes every six months. The idea was that a short term kept representatives honest to the needs of their constituents. Some of the Founding Fathers believed that federal representatives should also be held to the same tight leash — a one-year term.

Others at the Constitutional Convention argued that one year was far too short to get anything done in the federal government, where legislative business would be more complicated than in the states and colonies. As a practical matter, they also pointed out that it took months for some representatives to simply travel back and forth from their home states to the capital, so they lobbied for a three-year term in the House. In the end, the two sides compromised on a two-year term [source: U.S. House of Representatives].

With two-year terms, every single House seat is up for election every two years. That's why Americans vote for their House members during both presidential election years and midterms.

But midterms are not just about national races.

Advertisement

State and Local Midterm Elections

Stacy Abrams, governor candidate
Georgia Democratic gubernatorial candidate Stacey Abrams arrives to speak at the annual North America's Building Trades Union's Legislative Conference at the Washington Hilton Hotel April 6, 2022, in Washington, D.C. Drew Angerer/Getty Images

If you have voted in midterm elections, there were probably many more races on the ballot than just federal representatives. That's because many state and local governments schedule their elections on the same day as the November midterms.

For example, 36 states elect their governors during midterm elections. In 34 of those states, governors serve four-year terms. Residents of New Hampshire and Vermont elect governors to two-year terms, so gubernatorial elections are held there in both presidential election years and midterms [source: Ballotpedia].

Advertisement

And then there are midterm elections for seats in state legislatures. All 50 states, except Nebraska, have bicameral legislatures, meaning there are two chambers similar to the Senate and House of Representatives (most share those names, too) [source: Nebraska.gov]. State senators serve either two- or four-year terms, and most state representatives serve two-year terms (only five states have four-year terms for representatives).

With 50 states and 99 individual legislative bodies, that means thousands of state government seats are up for grabs during the midterms. In the 2022 midterm elections, there are 6,166 state legislative seats up for grabs. This represents 84 percent of the state legislative seats in the U.S. [source: Ballotpedia]. In states with two-year terms for state representatives, all seats are up for election in both presidential and midterm elections. Elections for state senators, like their federal counterparts, are mostly staggered.

Not only are state senators divided into three classes and elected in different years, but in many states the length of the term isn't fixed. In so-called 2-4-4 states, state senators are elected for either two or four years depending on the year of the election. Confused, yet?

The idea behind the 2-4-4 system is to ensure that there is an election every 10 years, because legislative districts are "reapportioned" (aka redistricted) every decade. Because redistricting gives significant advantages to incumbents, some legislatures want to make sure voters have a say in who is in office when those changes are made. Illinois is an example of state with a 2-4-4 election schedule.

Statewide ballot measures are another thing that Americans vote on during midterms. In the 2018 midterms, there were more than 160 proposals on state ballots either created by state legislatures or citizen petitions. Those included everything from financial proposals (taxes, bonds, state pensions) to highly politicized issues like legalization of marijuana and gender identity [source: NCSL]. As of this writing, 137 state ballot measures have been certified for the 2022 midterms [source: Ballotpedia].

Then there are myriad city, county and local elections held during midterms. For example, there are hundreds of mayoral seats up for election in the 2022 midterms, including some 72 mayorships in California alone [source: U.S. Conference of Mayors]. Same goes for city council seats, local boards of education, county comptrollers, coroners and more. That would explain all those lawn signs you see around your neighborhood.

Despite the sheer number of elections decided by midterms, relatively few Americans bother to show up to the polls. And those who do tend to cluster into similar demographic groups.

Advertisement

Voter Turnout and Voter Demographics in Midterm Elections

voting in primary election, New York City
A woman arrives at a polling station on New York state's primary Election Day, Sept. 13, 2018, in the Brooklyn borough of New York City. Drew Angerer/Getty Images

The United States struggles with voter turnout, even during presidential election years. But low voter turnout is compounded during midterm elections that lack the wall-to-wall media coverage of a presidential campaign. Ever since the voting age was lowered to 18 in 1971, voter turnout at midterm elections has averaged 17 percentage points lower than presidential elections. In other words, presidential elections average 56.4 percent of the electorate while midterm elections get around 39.3 percent [source: Skelley and Kondik].

Perhaps voter fatigue is partially to blame for the low turnout. Keep in mind that before this midterm election, there might have been primary elections held earlier in the year if two or more candidates from the same party were running for the same seat. Worse, there might also have been a runoff election a few months after the primary, depending on the state rules, if the top candidate didn't get more than 50 percent of the vote.

Advertisement

The 2014 midterm election registered the lowest voter turnout in a U.S. federal election since World War II [source: Montanaro]. Only 36.4 percent of eligible voters cast a ballot. The 2018 midterms, however, boasted the highest turnout in the previous 40 years at 53 percent, thanks in large part to 18-to-29-year-old voters, who increased their voter turnout 79 percent compared to 2014 [source: U.S. Census Bureau].

Not only is voter turnout at midterm elections generally low, but different demographic groups are more or less likely to participate in midterm elections. In general, midterm voters are older, whiter and more educated on average than general election voters [source: Skelley and Kondik]. In recent decades, this has had political implications, since older, whiter, more educated voters have been more likely to vote for Republican candidates (although the more-educated demographic trended Democrat in the 2016 election).

Since 1978, Republican voters have been more likely to show up for midterms by an average of 3 percentage points. The Republican turnout advantage has been greatest during midterms when a Democratic president is in the White House. In three such midterm elections, Republican voter turnout was 6 percentage points higher than Democrats (1978, 1994, 2010) [source: Enten].

From exit poll data, it's clear that nonwhite voters continue to make up a smaller percentage of midterm voters compared with presidential elections. For example, in the 2008 presidential election, 26 percent of all voters identified as nonwhite, but in the 2010 midterms, that share was only 23 percent. The same 3-point drop occurred between the 2012 presidential election and the 2014 midterms [source: Skelley and Kondik]. The 2018 midterms were an exception, with only a small drop in nonwhite voters from 26.7 percent in the 2016 to 25 percent in the midterms [sources: Krogstad and Lopez, Krogstad et al.].

Even with historic imbalances in voter turnout, one trend has proved true in almost every midterm election in the past 50 years — the party that controls the White House gets pummeled. In the next section, we'll explore the so-called "midterm penalty" and other theories for midterm power transfers.

Advertisement

Presidential Popularity and "The Midterm Penalty"

Midterms are typically bad news for the sitting president and his party. In all but three midterm elections since 1946, the party in the White House has lost seats in either the Senate, the House of Representatives or both [source: Prokop]. The phenomenon even has a name — the midterm penalty.

The conventional explanation for the midterm penalty is that midterms function as a referendum on the president's popularity. If the president has performed well in the first two years of his term — or the economy has performed well, as is often the case — the damage is limited to a few seats in either chamber. But if voter sentiment has turned sharply against the president and his party, the midterm losses can be crippling.

Advertisement

When you look at historic job approval data and midterm results, this explanation seems to hold water. Between 1946 and 2006, when a president registered a job approval rating over 50 percent at the time of the midterm, his party has only lost an average of 14 seats in the House of Representatives. When his approval rating dropped below 50 percent, his party has lost 36 seats on average [source: Jones].

Those are just the average losses. Individual midterm results make an even stronger case for the midterm penalty being linked to the president's performance. At the time of the 2010 midterms, for example, President Barack Obama's approval rating slipped to 45 percent and his party suffered heavy losses — 63 seats in the House and six in the Senate. Similarly, President George W. Bush's approval rating was a dismal 38 percent for the 2006 midterms and his party lost 30 House seats and six Senate seats [source: Jones]. In the 2018 midterms, President Donald Trump's approval rating sat at 45 percent and Republicans lost 40 House seats [sources: Enten, Politico].

But there are also competing theories to explain the midterm penalty. One is called the coattail effect [source: Murse]. The coattail effect is particularly strong when a president is swept into office in a landslide victory, like Barack Obama in 2008. Given Obama's popularity and wide appeal with Democrats, more people turned out at the polls in 2008 and 2012 to vote Democrat. Since most voters cast ballots along party lines, Democratic candidates down the ticket got a boost, from senators to House representatives to mayors. Those Democratic winners were, in effect, riding Obama's coattails.

During midterms, however, there is no coattail effect, or at least far less of an effect. There may be a few high-profile Senate races that draw larger numbers of partisan voters to the polls, but nothing close to presidential contests. The result is that the president's party, regardless of the president's performance or popularity, takes a hit during the midterms, because many of the voters who were excited to vote in the general election lack motivation to participate in the midterms.

A second theory for the midterm penalty is called negative voting. Political science research shows that people are more likely to vote when they have negative opinions of the president than when they have positive ones. At first, this data seems to support the theory that midterms are a referendum on the president. But there's a difference. Even if half of all voters support the president, fewer positive voters will show up at the polls compared to the other 50 percent who hate him. So, the midterm results may look like a resounding "protest vote" even though half the country has nothing to protest [source: Erikson].

The results of the 2022 midterms are expected to follow the same general trends, which has Democrats worried. As of this writing, President Joe Biden's approval rating ranges between 40 and 45 percent, which means that Republicans will likely win a significant number of House seats and maybe flip some Senate seats in November [source: Newsweek].

To wrap things up, let's take a look at some of the most remarkable midterm results in U.S. election history and their lasting political consequences.

Advertisement

Historic Midterm Elections

Grover Cleveland, second address
President Grover Cleveland reads his second inaugural address at the Capitol building in Washington, D.C., March 4, 1893. Just a year later, his Democratic Party was punished with the biggest political midterm reversal on record. Wikimedia Commons

The following are some of the worst trouncings, rarest victories and biggest transfers of congressional power in U.S. midterm history [sources: Frail, Murse, Branigin]:

  • 1894: In 1892, Grover Cleveland, a Democrat, became the first president to be elected to two non-consecutive terms. But soon after his reelection, the U.S. entered a crushing economic depression compounded by a huge railroad strike. Angry voters punished Democrats in the midterms, giving Republicans an additional 116 House seats and five Senate seats. It remains the biggest midterm political reversal on record.
  • 1930: After President Herbert Hoover, a Republican, failed to take action to stem the spread of the Great Depression, voters gave Democrats 49 House seats and eight Senate seats. The groundswell of labor unionists, farmers and racial minorities who opposed Hoover in the midterm would put Franklin D. Roosevelt in office and pave the way to the New Deal.
  • 1934: Riding the popularity of his New Deal policies, FDR's Democratic party picked up nine House seats and nine Senate seats, the greatest midterm performance ever for a party in control of the White House.
  • 1966: In the 1964 presidential race, Democrat Lyndon Johnson crushed Barry Goldwater with 90 percent of the electoral vote. But his support for the Vietnam War and the passing of progressive civil rights laws and Medicare cost him popular support. Democrats not only lost 47 House seats and three Senate seats, but Republicans also formed a conservative voting bloc that would put Richard Nixon in the White House in 1968.
  • 1974: Republicans took a beating in the midterms held a year after Richard Nixon's resignation over the Watergate scandal, losing 48 House seats and five Senate seats.
  • 1994: United by Newt Gingrich's "Contract for America," Republicans mounted a conservative revolution against President Bill Clinton, winning 52 House seats and eight Senate seats.
  • 2006: After gaining Republican seats in the 2002 midterm, held a year after the 9/11 attacks, Republican President George W. Bush took a "thumpin'" (his words) in the 2006 midterm. Voters frustrated with the administration's handling of the wars in Iraq and Afghanistan gave Democrats 30 House seats and six Senate seats.
  • 2010: The Tea Party rode conservative opposition to Democratic President Barack Obama to a massive Republican victory in the midterms, taking 63 House seats and six Senate seats, the most seats lost in a single midterm election since 1938. Obama memorably pronounced the loss a "shellacking."
  • 2018: Younger voters and nonwhite voters expressed their discontent with Republican President Donald Trump and his policies by taking 40 House seats for Democrats.

Advertisement

Lots More Information

Related Articles

More Great Links

  • Ballotpedia. "State Legislative Elections 2022." (April 28, 2022) https://ballotpedia.org/State_legislative_elections,_2022
  • Branigin, William. "Obama reflects on 'shellacking' in midterm elections" Nov. 3, 2020 (April 18, 2011). https://www.washingtonpost.com/wp-dyn/content/article/2010/11/03/AR2010110303997.html
  • Enten, Harry. "Do Republicans Really Have a Big Turnout Advantage in Midterms." FiveThirtyEight. Jan. 9, 2018 (Sept. 24, 2018) https://fivethirtyeight.com/features/do-republicans-really-have-a-big-turnout-advantage-in-midterms/
  • Erikson, Robert S. "The Puzzle of Midterm Loss." Southern Political Science Association. Nov. 4, 1988 (Sept. 24, 2018) https://www.uvm.edu/~dguber/POLS125/articles/erikson1.pdf
  • Frail, T.A. "Top 10 Historic Midterm Elections." Smithsonian.com. Oct. 13, 2010 (Sept. 24, 2018) https://www.smithsonianmag.com/history/top-10-historic-midterm-elections-65355118/
  • Jones, Jeffrey M. "Avg. Midterm Seat Loss 36 for Presidents Below 50% Approval." Gallup. Aug. 9, 2010 (Sept. 24, 2018) https://news.gallup.com/poll/141812/avg-midterm-seat-loss-presidents-below-approval.aspx
  • Krogstad, Jens Manuel and Lopez, Mark Hugo. "Black voter turnout fell in 2016, even as a record number of Americans cast ballots." May 12, 1017, (April 18, 2022) https://www.pewresearch.org/fact-tank/2017/05/12/black-voter-turnout-fell-in-2016-even-as-a-record-number-of-americans-cast-ballots/
  • McDonald, Michael P. "Who Voted in 2010, and Why It Matters for 2012." HuffPost. Nov. 4, 2010 (Sept. 24, 2018) https://www.huffingtonpost.com/michael-p-mcdonald/who-voted-in-2010-and-why_b_778842.html
  • Misra, Jordan. "Voter Turnout Rates Among All Voting Age and Major Racial and Ethnic Groups Were Higher Than in 2014." U.S. Census Bureau. April 23, 2019 (April 18, 2022). https://www.census.gov/library/stories/2019/04/behind-2018-united-states-midterm-election-turnout.html#:~:text=Fifty%2Dthree%20percent%20of%20the,2014%20election%20had%20the%20lowest.
  • Montanaro, Dominico. "2014 midterm election turnout lowest in 70 years." Nov. 10, 2014 (Sept. 24, 2018) https://www.pbs.org/newshour/politics/2014-midterm-election-turnout-lowest-in-70-years
  • Murse, Tom. "Why the President's Party Loses Seats in Midterm Elections." ThoughtCo. Aug. 14, 2018 (Sept. 24, 2018) https://www.thoughtco.com/historical-midterm-election-results-4087704
  • National Conference of State Legislatures. "State Legislative Races and Ballot Measures." (April 28, 2022) https://www.ncsl.org/research/elections-and-campaigns/statevote-2018-state-legislative-races-and-ballot-measures.aspx
  • Nebraska.gov. "Nebraska Unicameral" (Sept. 24, 2018) http://www.nebraska.gov/government/legislative/
  • Prokop, Andrew. "The Presidential Penalty." Vox. March 1, 2022 (April 18, 2022) https://www.vox.com/22899204/midterm-elections-president-biden-thermostatic-opinion
  • Skelley, Geoffrey and Kondick, Kyle. "How Midterms Do (and Do Not) Differ From Presidential Elections." University of Virginia Center for Politics. March 2, 2017 (Sept. 24, 2018) http://www.centerforpolitics.org/crystalball/articles/how-midterms-do-and-do-not-differ-from-presidential-elections/
  • The United States Conference of Mayors. "Election Results" (Sept. 24, 2018) https://www.usmayors.org/elections/election-results-2/
  • United States House of Representatives. "Biennial Elections." History, Art and Archives (Sept. 24, 2018) http://history.house.gov/Institution/Origins-Development/Biennial-Elections/
  • United States Senate. "The Senate and the United States Constitution" (Sept. 24, 2018)
  • USA.gov. "Midterm Congressional, State and Local Elections" (Sept. 24, 2018) http://history.house.gov/Institution/Origins-Development/Biennial-Elections/

Advertisement

Loading...